2017年2月17日 星期五

vscode for linux 把 make, gcc/g++, gdb, git 都整合起來吧!

你對於在 linux 要搞 vim + ctag + cscope + gtag + gdb + git, emacs + ctag + cscope + gtag + gdb + git 很苦惱嗎? 在網路上找了好幾十篇的文章, 一一試過之後還是搞不定嗎? 正常的, 我也是, vscode 現在來拯救 linux 開發人員了。

看到這篇《為什麼我從 Sublime Text 跳槽 Visual Studio Code?》才注意到 vscode 的, 平常我不太會去嘗試 vim, emacs 之外的工具。哥是正統 unix 開發人員, 只用那種很難用會折磨自己的工具。

但 vscode 真的整合的不錯, 可以當第二開發工具。把 git, make, gcc, gdb 整合起來吧!

fig 1 extensions
本來打算從 source code build, 哥是正統 unix 開發人員, 習慣從 source code 建構程式, 但是 build 不起來, 很快就放棄了。直接到 https://code.visualstudio.com/download 下載, 我是下載 tar ball。

不過在我第一次執行 vscode 就出問題, 整個畫面黒黑的看不到任何東西。

找到這連結後 https://github.com/Microsoft/vscode/issues/6379
執行 code --disable-gpu 解決執行的問題。
現在連開發工具 IDE 都要支援 GPU 阿!

vscode 裝起來之後就會有基本看程式碼的功能:
  • 跳到函式定義
  • 跳到變數定義

但如果要看哪些程式碼用到了這個函式, 需要 C++ Intellisense extension 還有 global (gtags) 6.5 的版本, 在程式碼目錄打 gtags 產生 gtag。這樣在函式按右鍵就會看到 Find All References 這個選項, 就會列出呼叫這個函式的程式碼。

第一步先來安裝 fig1 上的 extensions, 在 View/extensions 上選 extensions 視窗, fig1 就是我裝的 extensions。重開 vscode 或是在 extensions 上選擇 reload 即可生效。使用 GDB 需要安裝 Native Debug 這個 extension。

那個 c++ complete 的 extension 就是你想的那樣, vim + YouCompleteMe 是不是折磨死你了, 搞了半天就是搞不定, 我看到那麼長的文章就放棄了, 哥是正統 unix 開發人員, 沒在 complete 程式碼的, 遇到這麼難的設定很快就放棄了。

先來搞定怎麼用 gcc 編譯程式碼, 以 simple_compiler 為範例, 以下說明是參考《C/C++ for VS Code (Preview)》。

If you want to build your application from VS Code, you will need to generate a tasks.json file:

  • Open the Command Palette (Ctrl+Shift+P). [按下 Ctrl+Shift+P 開啟 command palette。]
  • Select the Tasks: Configure Task Runner command and you will see a list of task runner templates. [有好幾個列表, 選Tasks: Configure Task Runner]
  • Select Othersto create a task which runs an external command. [再選 Tasks: Configure Task Runner 裡頭的 Others]
  • 這裡會跳出 tasks.json 的修改視窗
  • Change the command to the command line expression you use to build your application (e.g. g++ -g main.cpp). 和連結例子不同, 由於我寫了 makfile, 所以在 tasks.json L5 我改為 make 即可。 args 那些通通不用了。
  • Add any required args (e.g. -g to build for debugging).
  • You can now build your application with (Ctrl+Shift+B)

修改 tasks.json

tasks.json
1 {
2     // See https://go.microsoft.com/fwlink/?LinkId=733558
3     // for the documentation about the tasks.json format
4     "version": "0.1.0",
5     "command": "make",
6     "isShellCommand": true,
7     "args": ,
8     "showOutput": "always"
9 }

C/C++ for VS Code (Preview)》原本的 tasks.json 範例, 直接填上 g++ 命令, 參考 command, args 這兩個欄位
{
    "version": "0.1.0",
    "command": "g++",
    "isShellCommand": true,
    "showOutput": "always",
    "args": ["-g", "main.cpp"]
}

[整合 GDB]

View/debug 秀出 debug 視窗,

fig 2 按下齒輪圖示


fig 3 選 c++ (GDB/LLDB)


fig 4 將 program 修改為產生的執行檔名稱 - c_parser
若是執行檔後面要接參數, 參考 launch_argument L10 的寫法。

launch_argument
 1 {
 2     "version": "0.2.0",
 3     "configurations": [
 4         
 5         {
 6             "name": "C++ Launch",
 7             "type": "cppdbg",
 8             "request": "launch",
 9             "program": "c_parser",
10             "args": ["<", "/git/simple_compiler/test_pattern/add_1.c"],
11             "stopAtEntry": false,
12             "cwd": "${workspaceRoot}",
13             "environment": [],
14             "externalConsole": true,
15             "linux": {
16                 "MIMode": "gdb",
17                 "setupCommands": [
18                     {
19                         "description": "Enable pretty-printing for gdb",
20                         "text": "-enable-pretty-printing",
21                         "ignoreFailures": true
22                     }
23                 ]
24             },
25             "osx": {
26                 "MIMode": "lldb"
27             },
28             "windows": {
29                 "MIMode": "gdb",
30                 "setupCommands": [
31                     {
32                         "description": "Enable pretty-printing for gdb",
33                         "text": "-enable-pretty-printing",
34                         "ignoreFailures": true
35                     }
36                 ]
37             }
38         },
39         {
40             "name": "C++ Attach",
41             "type": "cppdbg",
42             "request": "attach",
43             "program": "enter program name, for example ${workspaceRoot}/a.out",
44             "processId": "${command.pickProcess}",
45             "linux": {
46                 "MIMode": "gdb",
47                 "setupCommands": [
48                     {
49                         "description": "Enable pretty-printing for gdb",
50                         "text": "-enable-pretty-printing",
51                         "ignoreFailures": true
52                     }
53                 ]
54             },
55             "osx": {
56                 "MIMode": "lldb"
57             },
58             "windows": {
59                 "MIMode": "gdb",
60                 "setupCommands": [
61                     {
62                         "description": "Enable pretty-printing for gdb",
63                         "text": "-enable-pretty-printing",
64                         "ignoreFailures": true
65                     }
66                 ]
67             }
68         }
69     ]
70 }

已經可以編譯執行檔, gdb 也設定完成, 要怎麼 debug 呢?

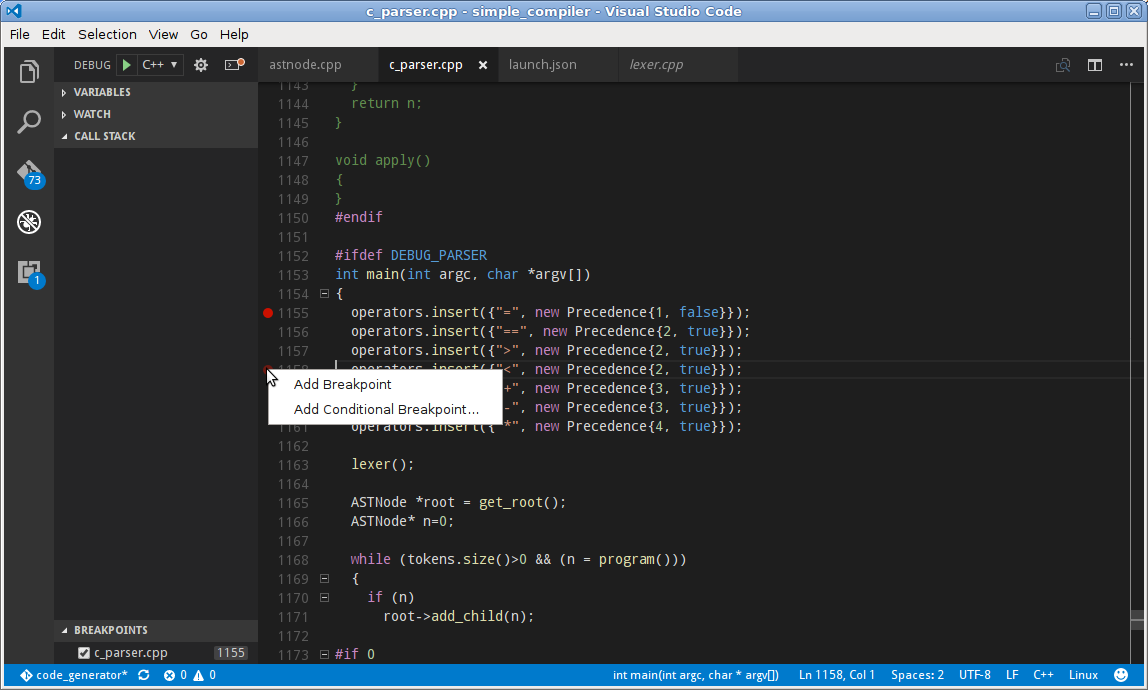
fig 5, 設定中斷點, 也可以按下 F9 來設定中斷點

fig 6. 按下去, 開始 debug
參考以下整合 gdb 畫面


[整合 git]
很簡單, 什麼都不用設定, 若原本就有使用 git 管理程式碼, 開啟那個目錄, 打開 View/git 就可以看到 git 操作畫面。可以打開 git output 視窗, 還可以知道對應的 git command 是怎麼執行的。

fig 7 顯示 git output 視窗 (按下 Show Git Output)
fig 8 將修改過的檔案加入 stage (index)
fig 9 將加入到 stage (index) 撤銷

有修改的檔案旁邊的 '+' 就是加入 stage (我習慣稱 index, git help 是使用 index 這個詞), '-' 就是反向操作。基本上還是要一點點的 git 知識才能好好使用這些功能, 但學起來比 command line 簡單不少。

安裝 git history 這個 extension, 看 git log 會有好看的樹節點。ctrl+shift+p 選 git history (log)

git history extension

我還裝了 vim extension, 在 vscode 上用 vim, 真是一種奇妙的感覺。

vscode 是用 Electron 寫的, 執行速度令人驚訝的快, 不會有 java 應用程式那種鈍鈍的感覺。而 extension 是用 typescript 寫的, 應該是很容易上手的語言。

所有設定檔都可以在程式碼目錄的 .vscode 找到。

ls simple_compiler/.vscode/
extensions.json 
launch.json 
tasks.json

ref:

沒有留言:

張貼留言

使用 google 的 reCAPTCHA 驗證碼, 總算可以輕鬆留言了。

我實在受不了 spam 了, 又不想讓大家的眼睛花掉, 只好放棄匿名留言。這是沒辦法中的辦法了。留言的朋友需要有 google 帳號。